The first tab that should be open is the Dashboard tab, but keep in mind that you can drag these tabs around so the order of your tabs may not match mine. I recommend putting them in an order that fits your workflow.
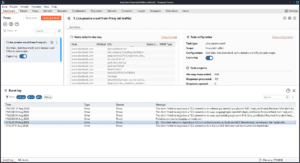
The Tasks section is where you can keep track of ongoing scans and processes.
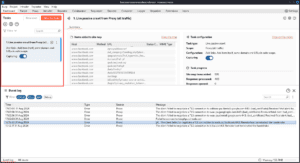
Note: This two features (Issue activity & Advisory) are available for the burpsuite professional version.
The Issue activity section is where you can see the findings from your scans.
Finding confidence is shown by how filled in the circle around the “!” is, a tentative finding that may be a false positive will be an outline, while certain findings are filled in completely. Finding severity is shown by color, with the highest severity being red.
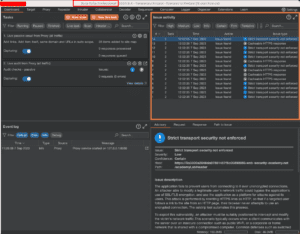
The Advisory section shows more info about each finding.
The information for each finding will go into detail about the vulnerability, including links for further information. You can also select the tabs at the top of the section to see the request and response that indicated the finding, as well as a path to the issue where applicable like showing where the sources and sinks for prototype pollution show up in the site’s source code.
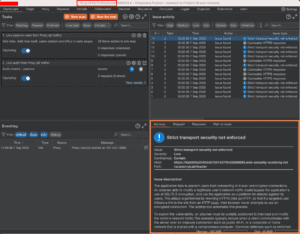
The Live passive crawl from proxy (all traffic about the websites) section is where you can see the summary of website (like Host, HTTP Request method, URL, Response status code and MIME) and Task configuration (like task type, scope, Task progress)
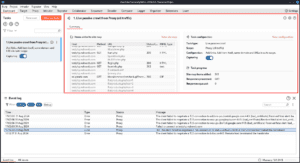
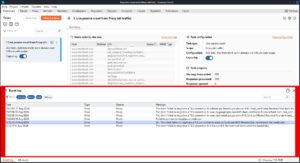
The event log shows basic activity information about things like scans and other processes.
In our next blog, we’ll shift our focus to the Target component of BurpSuite. We’ll explore how to effectively define and manage targets, as well as discuss advanced techniques for identifying and exploiting vulnerabilities.
Thank you for reading, and as always, happy testing!


